10.2 Blinding

From Sense & Sensibility & Science
Revision as of 15:30, 21 August 2023 by Gpe (talk | contribs) (// Edit via Wikitext Extension for VSCode)
Topic Cover - 10.2 Blinding.png

Blind analysis, the practice of deciding how we will analyze data before finding out if the analysis we have chosen supports our hypothesis, counteracts confirmation bias.


The Lesson in Context

This lesson offers solutions to potential pitfalls in scientific studies raised in 10.1 Confirmation Bias and 4.2 Finding Patterns in Random Noise. We use a stick measurement activity to illustrate the effects of confirmation bias and to motivate techniques to reduce its effect, especially blind analysis. These techniques are not universally employed in all fields of science today, and students pursuing a scientific career are encouraged to introduce these techniques in their own work.

4.2 Finding Patterns in Random NoiseTopic Icon - 4.2 Finding Patterns in Random Noise.png
  • Blind analysis is one way to prevent some forms of [math]\displaystyle{ p }[/math]-hacking. For example, choices to be made about a study, such as the exact statement of the hypothesis, definitions of terms, and statistical techniques, can be preregistered or made "blinded" to the data. The effects on the final result due to these choices may be hidden from the researcher during analysis. These techniques prevent motivated reasoning during analysis decisions.
10.1 Confirmation BiasTopic Icon - 10.1 Confirmation Bias.png
  • Blind analysis helps prevent scientists from the temptation to make choices that make the result more likely to confirm the researcher's own prediction or to match currently accepted knowledge. Otherwise, non-confirming, surprising results may be incorrectly missed.
13.1 Denver Bullet StudyTopic Icon - 13.1 Denver Bullet Study.png
  • In group decision making, when factual evaluation and values evaluation are made by two different groups of people without knowledge of the other, it prevents evaluation motivated by the need to confirm a personal belief.


Takeaways

After this lesson, students should

  1. Recognize what types of blinding are useful for solving what types of errors.
  2. Be able to explain why blind analysis might be needed, by explaining the errors that can arise in its absence.
  3. Recognize when blind analysis is being used and explain what function it serves. Identify situations and decisions in which blind analysis would be useful.
  4. Be able to evaluate techniques (e.g., registered replication, adversarial collaboration, peer review)
    1. for ability to address confirmation bias, and
    2. in comparison to blind analysis.
  5. Propose how to use blind analysis for simple studies.

Blind Analysis

Making all decisions regarding data analysis before the results of interest are unveiled, such that expectations about the results do not bias the analysis. Usually co-occurs with a commitment to publicize the results however they turn out.

Double Blind

Studies where both the participants and the administrators of the experiment are blinded as to whether they're in the control or intervention group.
Students may confuse blind analysis with a double blind experiment. The latter is used primarily in treatment testing in conjunction with a placebo, such that the patient is prevented from knowing whether they received the real treatment or placebo, and the doctor is also prevented from knowing this fact in order not to inadvertently reveal this fact to the patient through subtle signs. The former type of blinding applies to the analysis process once the data has been collected. In the case of treatment testing, blind analysis may be employed whether or not double blinding is.

Preregistration

A research group publicly commits to a specific set of methods and analyses before they conduct their research.

Registered Replication

One or more research groups commit to a specific set of methods and procedures to replicate earlier work to see if they get the same results (typically with the input of the original research team). Results are publicized regardless of outcome.

Registered Reports

When studies are peer reviewed and journals commit to publishing before the research is undertaken. This reduces publication biases where journals prioritize interesting or statistically significant findings over null results.

Adversarial Collaboration

Scientists with opposing views agree to all the details of how data should be gathered and analyzed before any of the results are known.

Peer Review

New results are evaluated by other experts in the same field to determine whether they are valid. This only reduces confirmation bias insofar as reviewers don't share the same biases.

Muon [math]\displaystyle{ g }[/math]−2 Experiment

This experiment performed highly precise measurements of the magnetic dipole moment of muons to test the theoretical predictions of the currently accepted model of elementary particles. Blinding is done by injecting a secret code into all of the data that would undergo analysis, so that the scientists involved would not make specific choices in the analysis in a way that makes the final value agree with the theoretical prediction. The secret code was kept in a physical locker, the opening of which was highly publicized in the announcement event. Once the data was "unscrambled", the result shows that there is indeed a sizeable deviation of the measured value from the theoretical prediction.

[math]\displaystyle{ p }[/math]-hacking and Preregistration

One way in which [math]\displaystyle{ p }[/math]-hacking could occur is to choose or alter the analysis method after one has seen the results of that method to be undesirable. As an example, suppose a psychologist performs an experiment with 100 participants, sees that the results are at a statistical significance of [math]\displaystyle{ p }[/math] = 0.06, just shy of the [math]\displaystyle{ p }[/math] < 0.05 threshold for publication. They then decide to recruit another 100 participants to "improve their results", finally leading to [math]\displaystyle{ p }[/math] = 0.04, good enough for publication. This is a form of [math]\displaystyle{ p }[/math]-hacking, as [math]\displaystyle{ p }[/math]-values can dip below 0.05 as one slowly increases the sample size simply by random chance. To guard against this phenomenon, the sample size of a study is a required item in the preregistration process.

<restricted>

Useful Resources

Recommended Outline

Before Class

The kabob kalimba activity requires some preparation. Make sure you're very familiar with the activity, print out the worksheets, and have lots of kabob skewers on hand. You will likely also want to be ready to visualize the results of the experiment. Additionally, you may want to briefly look at the next lesson so as to tell your students what to read for it.

During Class

80 Minutes This entire class is spent on the kabob kalimba activity.

Lesson Content

Kabob Kalimba

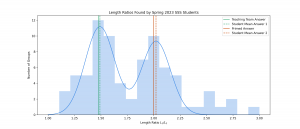
This activity gives the students a chance to try and make some scientific measurement while falling into or avoiding several of the pitfalls that blind analysis could help with. In groups of three, the students will be cantilevering wooden skewers off the edge of a table and measuring the lengths at which they produce notes of different frequencies. The students' ultimate task is to find the ratio of the lengths of skewer stick (measured from the edge of the table to the end of the stick) for two notes that are an octave apart. The actual value is [math]\displaystyle{ \sqrt{2}\approx1.41 }[/math]. But, there is substantial priming to suggest to the students that the value they should expect is two. If the students think of applying the methods of blind analysis, they should be able to avoid falling into this trap.

Preparation

  1. Print out at least one copy of the worksheet for every three students.
  2. Acquire at least ten wooden kabob sticks for every three students.
  3. Make sure you have some method to number the groups the students work in.
  4. Have at least one sheet of paper for students to write down their final answers on.

Instructions

5 Minutes Introduce and set up the activity.
  1. Go through the slides briefly introducing the activity. You may also have to demonstrate it.
  2. Split the class into groups of three.
  3. Assign each group a number.
  4. Give every group a copy of the worksheet.
  5. Remind the students to try and whisper for this activity so as to not mess up other people's data.
30 Minutes Let the students work on the activity and try to get their measurements.
5 Minutes Debrief the students on the gimmick of the activity.
  1. Have every group submit their final ratio answer to the Google form along with their group number.
  2. Reveal the final answer and the "trick" of this activity.
  3. Display and go through the answers the students came up with to see if anyone used or could have benefitted from blind analysis.
20 Minutes Go through the whole-class discussion questions.
10 Minutes Have students discuss the small group discussion questions.
10 Minutes Call everyone back to go over the same discussion questions with the entire class.

Whole-class Discussion Questions

Ask these questions to the entire class. Spend about a minute on the first question, three on the second, and four minutes on each of the other questions.

  1. What do you think the correct answer is? (Hint: It is not 2.)
  2. Which senses or measurement instruments did you use?
  3. What is the signal you are trying to measure, and what are the sources of noise?
  4. What are the sources of systematic and statistical uncertainty? How did you address them?
  5. What are some choices you had to make in your measurement and analysis? What are some places into which confirmation bias could have crept?
  6. Did you use blind analysis? If so, how did you do it?

Small Group Discussion Questions

Have your students spend about five minutes on each of these questions in small groups. When done with both questions, call everyone back and ask the questions to the entire class.

  1. Is there anything you would do differently to guard against bias in the measurement process?

There's lots of ways to do this. But, they're all based around division of labor. The person listening for the octaves should probably not be the person using a ruler and making the measurements. You also could have someone independently make rules with different new units that convert inches or centimeters in ways that are unknown to the measurer.

  1. Is there anything you would do differently to guard against bias in the analysis process?

This also depends on division of labor. What's most important is that the person doing the analysis has no sense of that the actual ratio values are when they're deciding what data points to include or not. The person measuring may also add a secret number to their measurements that's not revealed to the analyzer until after the analysis work is complete.

Priming

Results from running this activity in Spring 2023 at UC Berkeley.

There's lots of places where students are primed to think the answer is two instead of [math]\displaystyle{ \sqrt{2}\approx1.41 }[/math].

  • The worksheet mentions that "[Pythagoras] found that when two strings of different lengths are plucked simultaneously, a pleasant harmony between the notes would be heard when the string lengths formed a simple ratio, for example, 2:1.
  • The worksheet also explains that "An octave interval then corresponds to exactly doubling the frequency of this strongest component."
  • The spreadsheet has a prefilled example ratio that is approximately two.
  • The spreadsheet automatically calculates results and presents them on a plot where the center value is two.

</restricted>